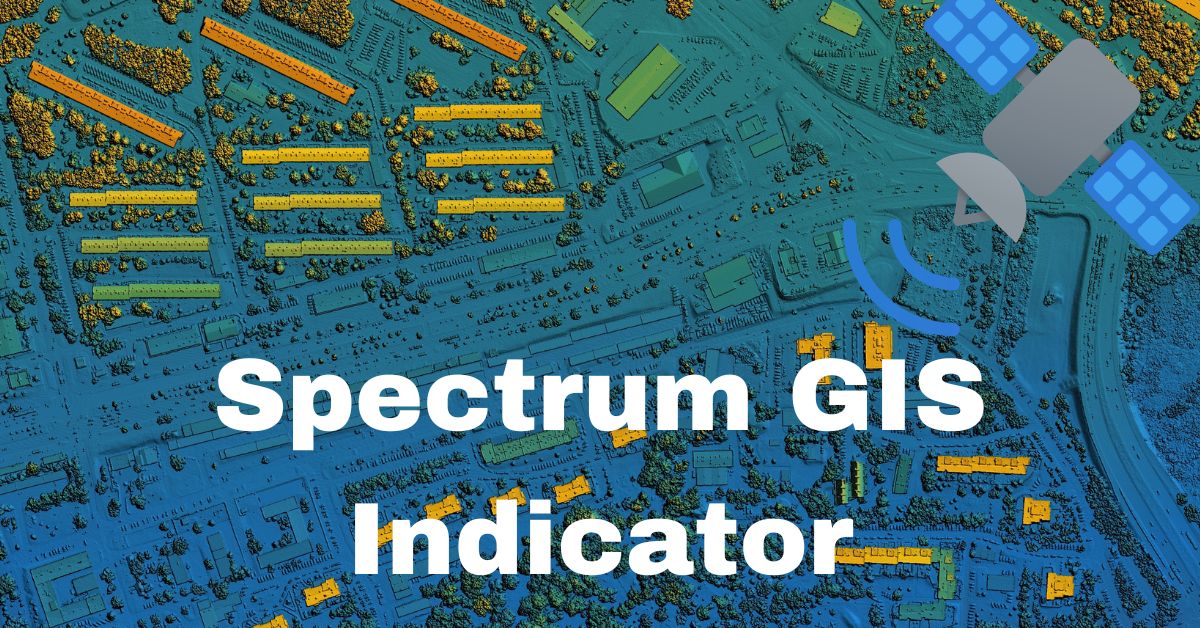
Geographic Information Systems (GIS) have evolved from basic mapping tools to advanced systems capable of processing, analyzing, and interpreting vast amounts of spatial data.
At the heart of this evolution lies the concept of the GIS indicator spectrum—a multidimensional framework for categorizing, visualizing, and analyzing geospatial indicators to support decision-making in diverse domains, from urban planning to environmental conservation.
What Is the GIS Indicator Spectrum?
The GIS indicator spectrum refers to the range and depth of indicators that can be derived from geospatial data. Indicators in this context are metrics or values representing specific phenomena, conditions, or processes on the Earth’s surface. These indicators can be categorized based on their thematic focus, spatial scale, temporal resolution, and analytical purpose.
For instance, indicators might range from demographic data in urban studies to vegetation health in remote sensing applications. The spectrum helps GIS professionals standardize and contextualize data, enabling meaningful comparisons and robust insights.
Components of the GIS Indicator Spectrum
- Thematic Focus
Indicators in GIS are tailored to specific fields of interest. For example: - Environmental Indicators: Metrics such as forest cover, air quality indices, or water pollution levels.
- Socioeconomic Indicators: Data on population density, income distribution, or education levels.
- Infrastructure Indicators: Urban connectivity, road network efficiency, or utility service coverage.
- Spatial Scale
GIS indicators vary greatly in spatial granularity, ranging from local to global scales. - Micro-scale Indicators: Focused on neighborhoods or individual buildings, such as energy efficiency ratings.
- Macro-scale Indicators: Regional or global metrics like climate change vulnerability or migration patterns.
- Temporal Resolution
Temporal factors are critical for dynamic analysis: - Static Indicators: Single snapshots of conditions, such as land use maps for a particular year.
- Dynamic Indicators: Time-series data capturing trends or shifts, such as annual urban sprawl rates.
- Analytical Purpose
GIS indicators serve varied purposes, from monitoring to predictive analysis: - Descriptive Indicators: Offer a foundational understanding of a spatial phenomenon.
- Predictive Indicators: Enable forecasting, such as predicting flood-prone areas based on historical data.
- Prescriptive Indicators: Support decision-making, e.g., identifying optimal locations for renewable energy projects.
The Role of Technology in Enhancing the GIS Indicator Spectrum

Advances in technology have significantly expanded the scope and utility of the GIS indicator spectrum. Key innovations include:
- Remote Sensing: Satellites and drones provide high-resolution imagery, enhancing the accuracy of environmental and land-use indicators.
- Artificial Intelligence (AI): Machine learning models analyze spatial patterns and extract indicators with minimal human intervention.
- Big Data Integration: GIS systems now incorporate real-time data streams from IoT devices, enabling the creation of dynamic indicators such as real-time traffic congestion levels.
- Cloud Computing: Enables the processing of vast datasets, ensuring indicators are generated efficiently, even for large-scale projects.
Applications of the GIS Indicator Spectrum
- Urban Planning
City planners use GIS indicators to optimize land use, infrastructure development, and resource allocation. For instance, walkability scores and public transit coverage are common indicators. - Environmental Management
Conservationists analyze indicators like deforestation rates or biodiversity hotspots to prioritize areas for protection. - Disaster Management
GIS indicators such as flood susceptibility maps or seismic risk assessments play a critical role in disaster preparedness and response. - Public Health
Spatial analysis of disease incidence or healthcare accessibility indicators guides resource allocation and policy decisions.
Future Directions and Challenges
As GIS technology continues to evolve, so too will the GIS indicator spectrum. Anticipated developments include:
- Integration of Citizen Science: Crowdsourced data could augment traditional indicators, especially in under-mapped regions.
- Enhanced Predictive Analytics: Combining GIS with AI and climate models to create forward-looking indicators.
- Ethical Considerations: Ensuring privacy and fairness in the use of GIS indicators, particularly in surveillance or socioeconomic contexts.
However, challenges persist, including the standardization of indicators across regions and the need for interoperable data formats. Additionally, addressing data gaps in resource-poor settings remains a critical priority.
Conclusion
The GIS indicator spectrum is a vital framework for extracting actionable insights from geospatial data. By categorizing and analyzing indicators based on thematic focus, spatial scale, and temporal resolution, GIS professionals can address complex challenges with precision and foresight.
As technology continues to advance, the potential of the GIS indicator spectrum to drive innovation and inform decision-making across sectors is bound to grow, offering new horizons for geospatial analytics. For more spectrum Internet information check the internetgainer.


